
What is Lewontin's fallacy?
In 1972, Jewish American geneticist Richard Lewontin published a book chapter called The Apportionment of Human Diversity. He wrote:
The results are quite remarkable. The mean proportion of the total species diversity that is contained within populations is 85.4%, with a maximum of 99.7% for the Xm gene, and a minimum of 63.6% for Duffy. Less than 15% of all human genetic diversity is accounted for by differences between human groups! Moreover, the difference between populations within a race accounts for an additional 8.3%, so that only 6.3% is accounted for by racial classification.
... [technical aspects of the numbers] ...
It is clear that our perception of relatively large differences between human races and subgroups, as compared to the variation within these groups, is indeed a biased perception and that, based on randomly chosen genetic differences, human races and populations are remarkably similar to each other, with the largest part by far of human variation being accounted for by the differences between individuals.
Human racial classification is of no social value and is positively destructive of social and human relations. Since such racial classification is now seen to be of virtually no genetic or taxonomic significance either, no justification can be offered for its continuance.
Restated, Lewontin's argument contains the following two premises:
- If the genetic variance between human populations/races is small compared to that between individuals, then "Human racial classification is of no social value and is positively destructive of social and human relations. Since such racial classification is now seen to be of virtually no genetic or taxonomic significance either, no justification can be offered for its continuance."
- The genetic variance between human populations/races is small compared to that between individuals, namely, about 15%/6%.
This is an old book chapter based on outdated methods. Do the numbers still hold up? Yes. For instance, a 2012 study of the HAPMAP project found 12% variance between populations, based on 602 samples with 3M SNPs (Elhaik 2012).
The problem is not with the second premise, but the first. Ignoring the irrelevant politics that Lewontin attempts to inject, it is just plainly false. A single SNP is not of much use to classifying individuals. However, when many SNPs are used together, it is very easy to classify individuals. This was pointed out in a famous reply paper in 2003 (Edwards, 2003) titled: Human genetic diversity: Lewontin's fallacy. Edwards wrote:
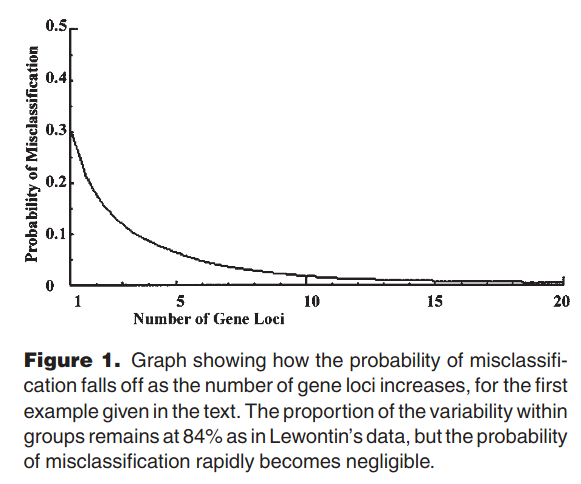
In popular articles that play down the genetical differences among human populations, it is often stated that about 85% of the total genetical variation is due to individual differences within populations and only 15%to differences between populations or ethnic groups. It has therefore been proposed that the division of Homo sapiens into these groups is not justified by the genetic data. This conclusion, due to R.C. Lewontin in 1972, is unwarranted because the argument ignores the fact that most of the information that distinguishes populations is hidden in the correlation structure of the data and not simply in the variation of the individual factors.The underlying logic, which was discussed in the early years of the last century, is here discussed using a simple genetical example.
The principle is illustrated with a graph:
This principle is why modern ancestry testing (e.g. 23andme, ancestry.com) works as well as it does. The tests typically rely on 100,000s of SNPs for an individual. A simple way to illustrate this is to look at principal component plots based on many thousand SNPs. This figure is based on 20 populations in the 1000 genomes dataset from Gaspar and Breen (2019):
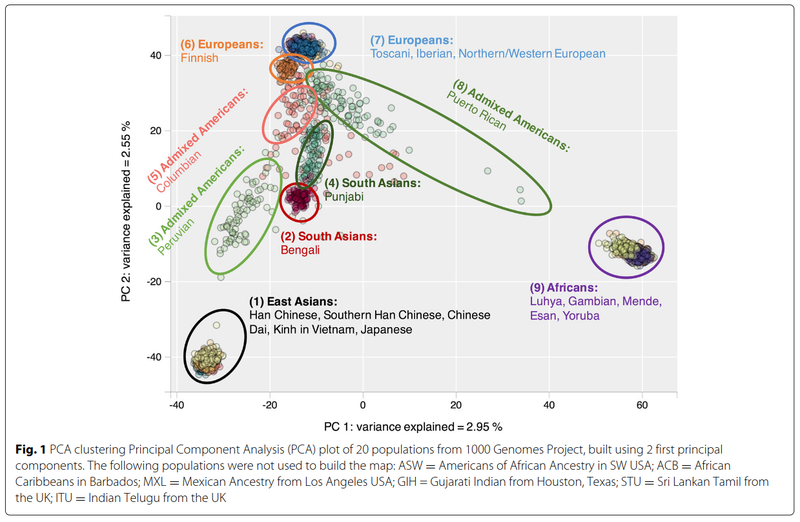
Note that for simplicity of visual representation, only 2 dimensions are shown. If more dimensions were used, then various other populations could also easily be distinguished (e.g. South Asians). Nevertheless, we see here that for the unadmixed ('pure') populations of Europeans (on the top), Africans (right), Asians (bottom), it is very easy to distinguish them, and no individual is placed in the wrong cluster. The error rate for classification is 0%. The mixed populations, such as Puerto Ricans, are in between the source populations (Europeans and Africans) in a cline.
Sources
Lewontin, R. C. (1972). “The Apportionment of Human Diversity”. Evolutionary Biology. pp. 381–398.
Elhaik, E. (2012). Empirical distributions of F ST from large-scale human polymorphism data. PloS one, 7(11), e49837.
Edwards, A. W. (2003). Human genetic diversity: Lewontin's fallacy. BioEssays, 25(8), 798-801.
Gaspar, H. A., & Breen, G. (2019). Probabilistic ancestry maps: a method to assess and visualize population substructures in genetics. BMC bioinformatics, 20(1), 1-11.